
Figure 2.
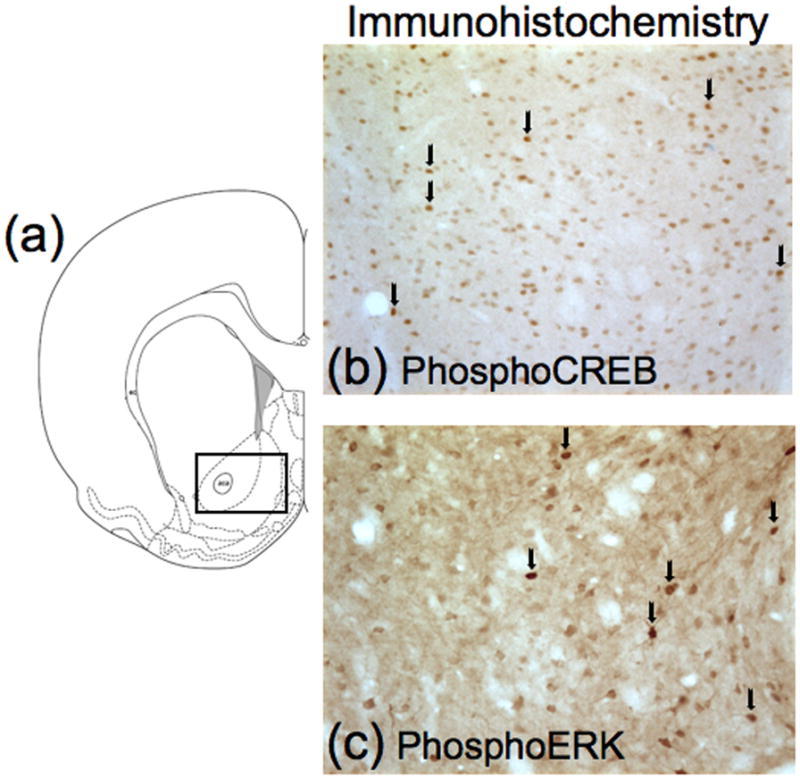
Schematic representation of brain regions and immunohistochemistry images. (a) Schematic of coronal section approximately 1.8 mm anterior to Bregma employed in the immunohistochemistry detection. Drawings of coronal sections and coordinates were obtained from the atlas of Paxinos & Watson (1998). The rectangle represents the area used to protein quantification. (b) Example of phosphoCREB-immunoreactive nuclei in nucleus accumbens. (c) Example of phosphoERK-immunoreactive cells in nucleus accumbens. Arrows indicate immunoreactive cells.