
Fig. 4.
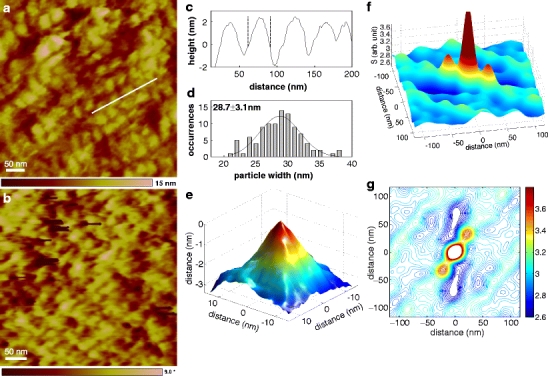
a Topographic image of cytosolic side of OHC membrane treated with prestin antibodies followed by antirabbit secondary antibodies. b Phase image of unlabeled preparation for comparison (same scale). c Height profile along the sectional line in image a. The distance between the two vertical dashed lines is 28.7 nm. The average value is 28.7 ± 3.1 nm obtained from different sections of the image a. d Particle size distribution. The solid line is a Gaussian fit to data. e Reconstructed tip shape. f The autocorrelation function limited to central regions for the background-subtracted gray scale image of a (see “Data acquisition and analysis” section). g The same autocorrelation function presented as contours