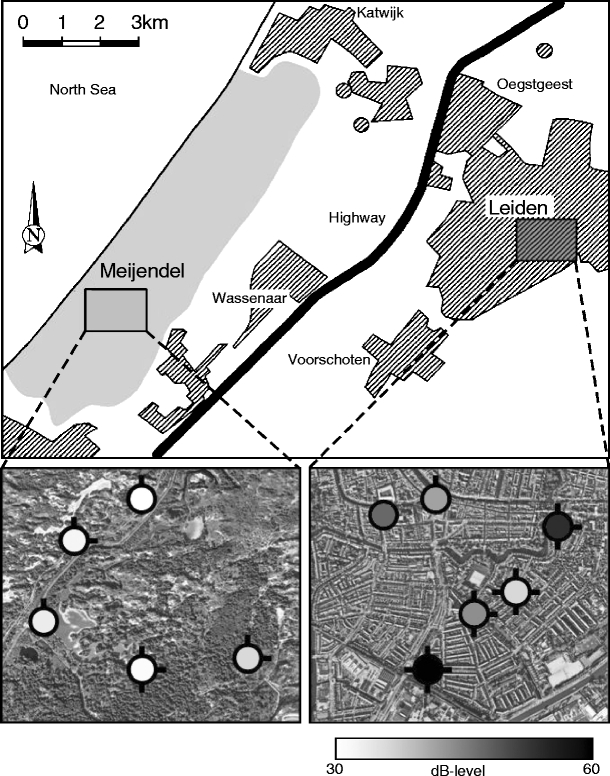
Fig. 2.

Illustration of the study areas. The schematic map at the top of the illustration shows an overview of the locations of the two study areas, Meijendel and Leiden. Barred areas indicate urban habitat, and the light-grey area is forest-dune habitat. The left and right maps at the bottom of the illustration are satellite images of parts of the study areas in Meijendel and Leiden, respectively. Circles show territories in which blackbirds were recorded. The colours of the circles represent the anthropogenic noise level in the territories measured during the dawn chorus in Meijendel and between 7:30 a.m. and 8:30 a.m in Leiden (see the “Materials and methods” section for details). The number of lines attached to the circles represents the number of neighbours around the territory that were heard singing during the dawn chorus (see the “Materials and methods” section for details)
