
Fig. 4.
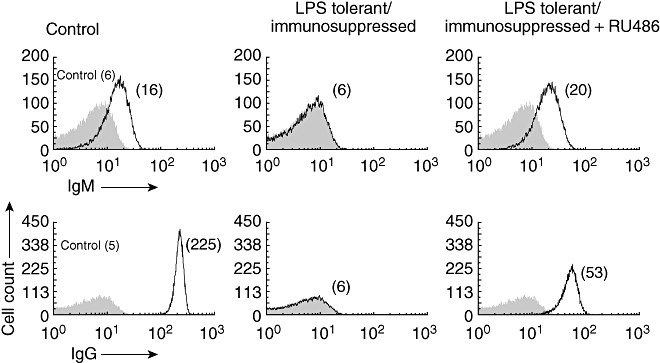
Immunoglobulin (Ig)M and IgG anti- sheep red blood cell (SRBC) levels were compared between the different groups using a 1 : 300 dilution. Data show a representative experiment of three. Number in parentheses represents the median fluorescent intensity (MFI). Control: naive mice immunized.