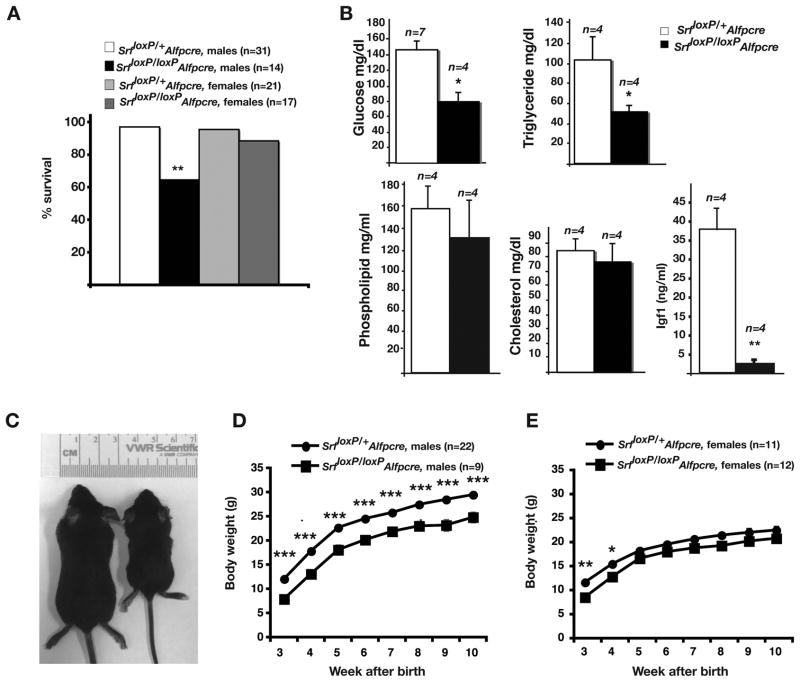
Figure 2. SrfloxP/loxPAlfpCre mice show increased mortality, disrupted serum glucose and triglyceride levels, and diminished body growth.
A) Bar graph showing percent of male and female Srf loxP/+Alfp-Cre and Srf loxP/loxPAlfp-Cre mice surviving until 10-weeks of age. Two-sided Fisher Exact Test, ** p=0.024. B) Bar graphs showing serum levels of glucose, triglycerides, phospholipids, cholesterol and IGF1 in control (Srf loxP/+Alfp-Cre) and mutant (Srf loxP/loxPAlfp-Cre) male mice at 3wks of age; Student’s t-test, * p≤0.01, ** p≤0.001. C) Photograph showing size comparison between control (Srf loxP/+Alfp-Cre; left) and mutant (Srf loxP/loxPAlfp-Cre; right) mice at 3-weeks of age. D, E) Graphs showing difference in body growth over time between control (circles) and mutant (squares) male (D) and female (E) mice. Tukey-Kramer post-hoc multiple comparison test (*p≤0.05, **p≤0.01, *** p≤0.005).

