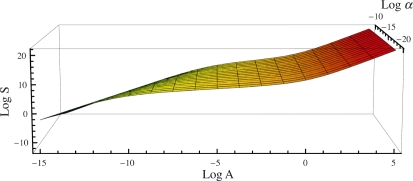
Figure 2.
The species–area relationship (SAR) as a function of the demographic parameter α, and with the dimensionless combination of parameters θπσ2/α fixed to be 1000. On the z-axis is the logarithm of species number, S, on the x-axis the logarithm of sampled area, A and on the y-axis, the logarithm of α. Area is measured in units of σ2/α, so that the transition to the large-scale linear phase occurs at A = 1 and hence log A = 0, in these units. The SAR displays three distinct phases, with close to linear behaviour for small areas, exactly linear behaviour for large areas and approximately power law behaviour at intermediate scales. As α becomes smaller the central phase becomes broader and the exponent of the approximate power law decreases. The region shaded red indicates the large-scale linear phase, the linear shaded yellow the power law phase and the region shaded green the small-scale sampling phase.

