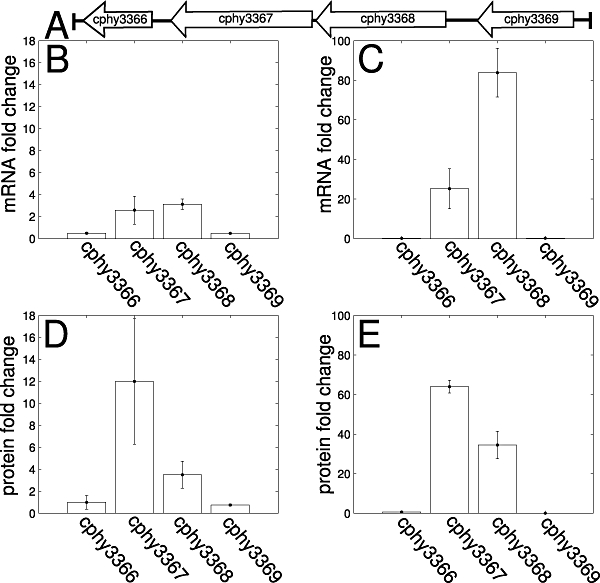
Fig. 5.

Expression changes of cphy3367 and surrounding genes (A) in the genome on different carbon sources. Wild-type mRNA (B and C) and protein (D and E) expression of cphy3367 and cphy3368 increased in hemicellulose (B and D) and cellulose (C and E) cultures compared with glucose while expression of the surrounding genes did not increase. The mRNA expression was measured by qRT-PCR. Bars show mean fold change calculated as 2−ΔΔCt. Protein expression was quantified by mass spectrometry. Bars show mean number of peptides detected from each protein in hemicellulose or cellulose cultures divided by the number of peptides detected in glucose cultures.
