
Fig. 2.
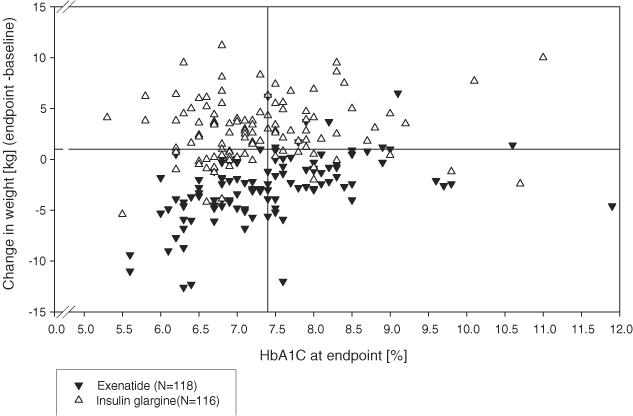
Scatter plot of changes in body weight vs. HbA1c concentration after 26 weeks of exenatide or insulin glargine treatment in patients with type 2 diabetes; the horizontal line shows a weight gain of 1 kg and the vertical line shows an HbA1c of 7.4%.