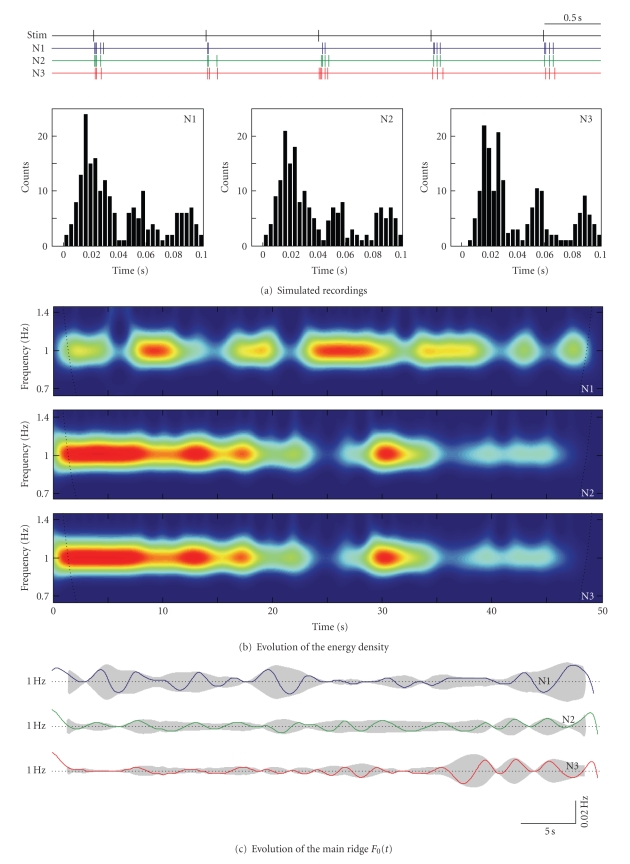
Figure 3.
Quantification of the dynamical stability of the stimulus response patterns for three neurons. (a) Stimulus and spike trains (only 5 s epoch shown) of three neurons. The three neurons have fairly the same PSTHs, but their firing dynamics is significantly different (see the main text). (b) Wavelet energy spectra of the spike trains in the stimulus frequency band (color from blue to red corresponds to the spectrum magnitude). (c) Time evolution of the main spectral ridges for the three spike trains. Shadow areas correspond to the envelops of F 0(t) (obtained by the Hilbert transform). (d) Different response stability measures: (left) Inverse of the standard deviation of the number of spikes; (middle) Inverse of the standard deviation of the magnitude of the energy density at 1 Hz; and (right) The dynamical stability factor S. The latter characteristics reveals distinctions in the stimulus responses of the neurons.


