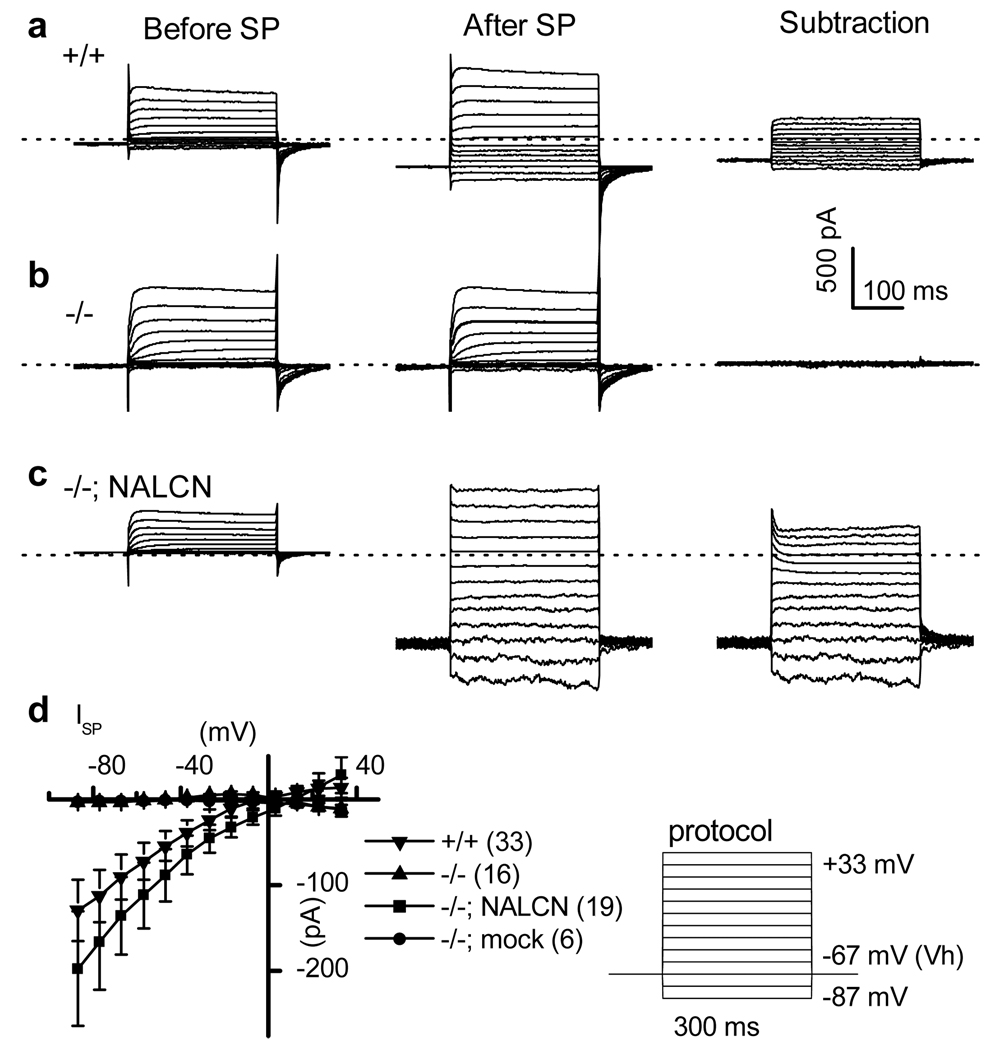
Figure 2. Characterization of the ISP in hippocampal neurons.
a–c, Net SP-activated currents at various voltages (right) were obtained by subtracting the currents before (left) from after (middle) SP bath application (1 µM) in wild-type (+/+) (a), mutant (−/−) (b), and mutant transfected with NALCN (−/−; NALCN) (c). Dotted lines indicate 0 current level. d, Averaged ISP amplitudes. The lines from mutant (−/−) and mutant transfected with empty vector (−/−; mock) overlap. Right panel shows the voltage step protocols used. Error bars, mean ± s.e.m.

