
Fig. 3.
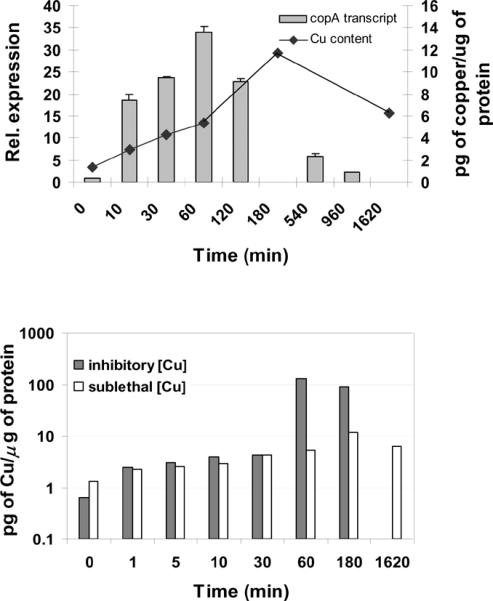
Time course analysis of copper content and copA induction in response to copper. (a) Total RNA was isolated at different times after treatment of the cultures with 0.75 mM copper. Samples were not collected at 180 and 1620 min. Results are expressed as means ± standard errors. Bars represent the normalized ratio between amounts of transcript in copper treated and untreated cultures. For comparison, changes in copper content (◆) after exposure to 0.75 mM copper are superimposed. (b) Copper content in cultures treated with 0.75 mM (white bars) or 1.25 mM copper (dark bars).