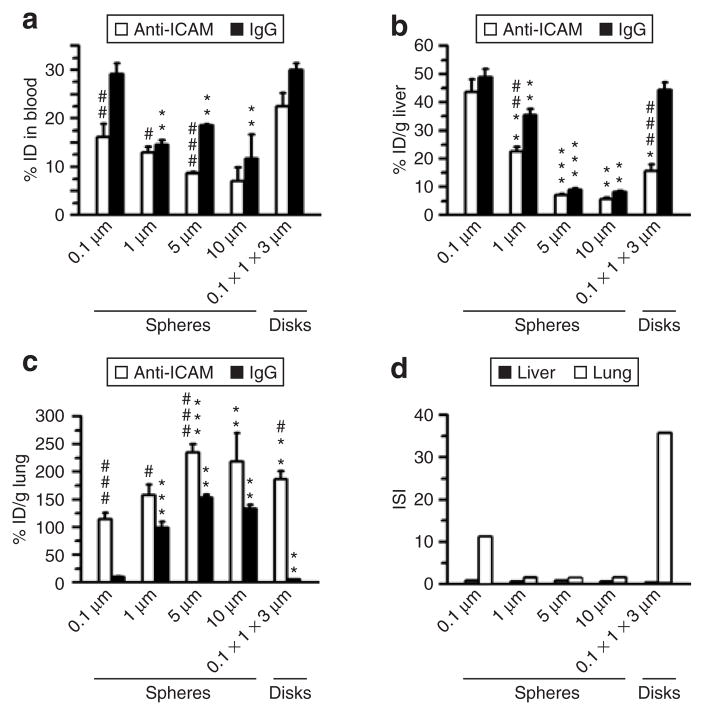
Figure 1. Role of geometry in the pharmacokinetics and biodistribution of anti-ICAM carriers in mice.
(a) Blood level of anti-ICAM (white bars) versus immunoglobulin G (IgG) (black bars) particles of various geometries (0.1, 1, 5, and 10 μm spheres, and 0.1 × 1 × 3 μm disks), calculated as percentage of injected dose (% ID) remaining in the circulation 1 minute after intravenous injection in C57BL/6 mice. (b) Liver uptake and (c) lung uptake (expressed as % ID per gram) of anti-ICAM (white bars) versus IgG (black bars) formulations, 30 minutes after injection. (d) The immunospecificity index (ISI) in liver (black bars) and lung (white bars) represents the anti-ICAM-to-IgG particle ratio, calculated as % ID/g in each of these tissues. Data are mean ± SEM (n ≥ 4 mice). *, Compares particles of any given micron-range size to 0.1 μm. #, compares anti-ICAM particles to IgG counterparts. * or #, P ≤ 0.05; ** or ##, P ≤ 0.01; *** or ###, P ≤ 0.001, by Student’s t-test. ICAM, intercellular adhesion molecule 1.

