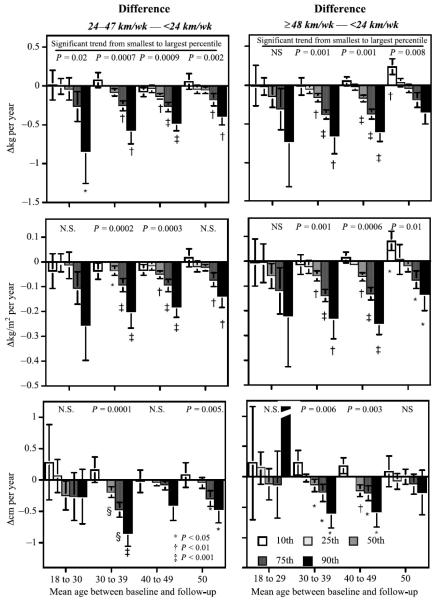
FIGURE 3.
Difference in the annual change in body mass (top), BMI (middle), and waist circumference (bottom) between women who ran less than 24 km/wk, from those running 24–47 km/wk (left), and from those running ≥ 48 km/wk (right). Results are presented by age groups (x-axis) and percentile of weight change (legend). Significance levels for differences greater than zero are designated by symbols. Probabilities presented above the bars are for the significance of a linear trend going from the smallest to the highest percentile (percentile effect). SE are shown in brackets.

