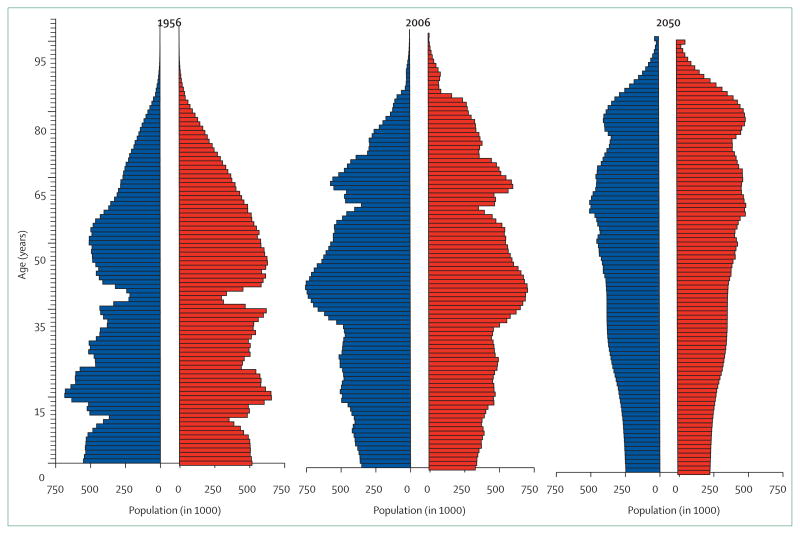
Figure 3. Population pyramids for Germany in 1956, 2006, and 2050.
Horizontal bars are proportional to number of men (blue) and women (red). Data for 2050 are based on the German Federal Statistical Office’s 1-W1 scenario, which assumes a roughly constant total fertility rate of 1·4, yearly net migration of 100 000 and life expectancy in 2050 reaching 83·5 years for men and 88·0 years for women. Data from reference 33 and the Human Mortality Database.

