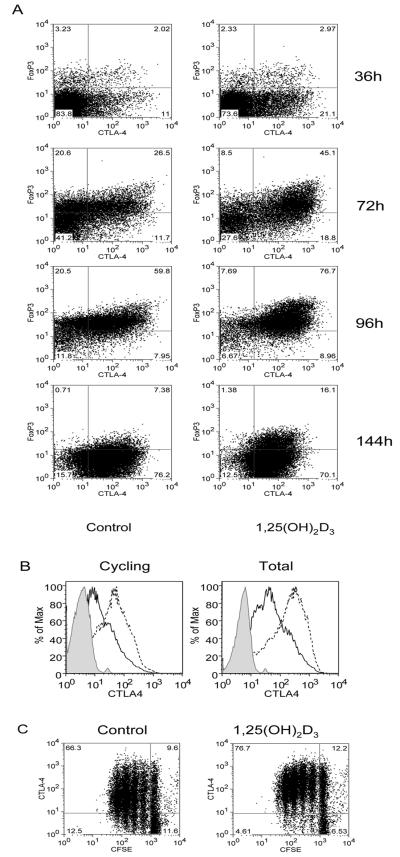
Figure 4. Expression of FoxP3 is not stably maintained by 1,25(OH)2D3.
(A) Purified CD4+CD25− T cells were stimulated with anti-CD3/CD28 coated beads in the presence of 100nM 1,25(OH)2D3 or vehicle control for the times shown. Cells were analysed for expression of CTLA-4 and FoxP3. (B) Expression was determined for both the total and re-cycling pool of CTLA-4. Dotted lines indicate expression in the presence of 1,25(OH)2D3 whereas black lines indicate vehicle control. The shaded histogram represents isotype control staining. (C) CFSE labelled CD4+ CD25− T cells were stimulated as above and analysed for CTLA-4 expression in combination with cell division. Numbers in quadrants refer to percentage of cells. Data shown is from a single experiment representative of 3 carried out.

