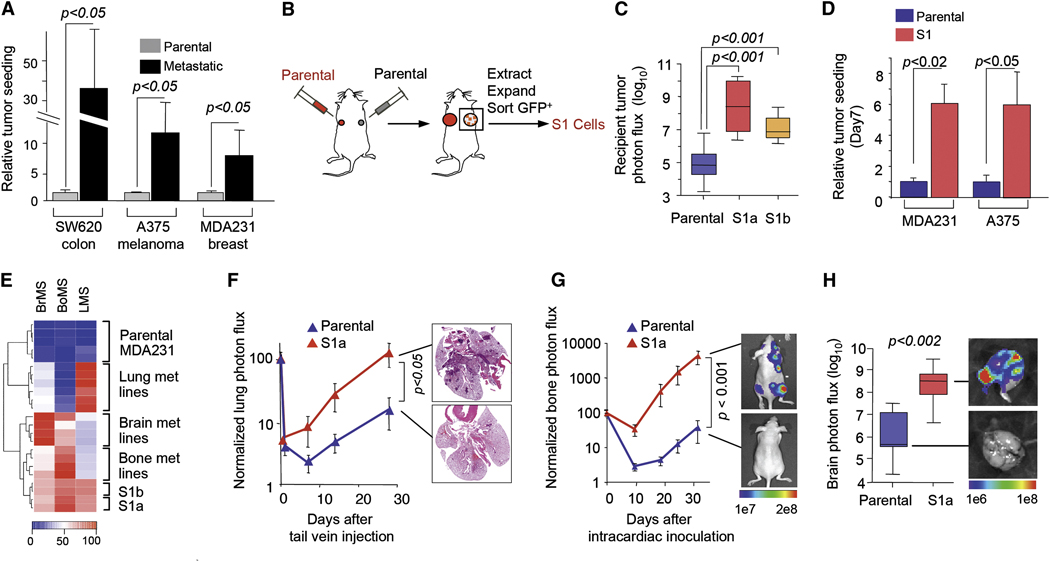
Figure 2. Preferential tumor seeding by metastatic cell progenies.
(A) Comparison of seeding activity of highly and poorly metastatic cells. Contralateral-seeding experiments were performed with the GFP/luciferase-expressing parental cancer cell lines, or with their lung metastatic (SW620-LM1, MDA231-LM2) or bone metastatic derivatives (A375-BoM2). Relative luminescent signals are plotted.
(B) A schematic diagram of isolation of seeder cell populations. For details see Experimental Procedures.
(C) Comparative tumor-seeding ability of in vivo-selected seeder cells (MDA231-S1a and S1b) and parental MDA231 cells in contralateral-seeding experiments as described in Figure1A. n= 6–8.
(D) Comparative tumor-seeding ability between parental and in vivo-selected seeder cells (MDA231-S1 and A375-S1) from the circulation as described in Figure 3A. n= 8–10.
(E) The gene expression profiles of parental MDA231, various metastatic derivatives and the seeder lines S1a and S1b were scored with gene expression classifiers for metastasis to lung (LMS), bone (BoMS) or brain (BrMS). Raw scores were scaled between 0 and 100.
(F) Left: Parental or MDA231 S1a cells were inoculated intravenously into mice. Lung colonization was measured by BLI and quantified. n=6–7. Right: representative histological staining (H&E) of lung sections from the experiment on the left.
(G, H) Cells were inoculated into the cardiac left ventricle. Bone colonization was measured by BLI and quantified; n=12. Brains were extracted and colonization was measured by BLI; n=5–7.
Error bars in all cases represent SEM and p values were based on two-tailed Mann-Whitney test; for details see Experimental Procedures.

