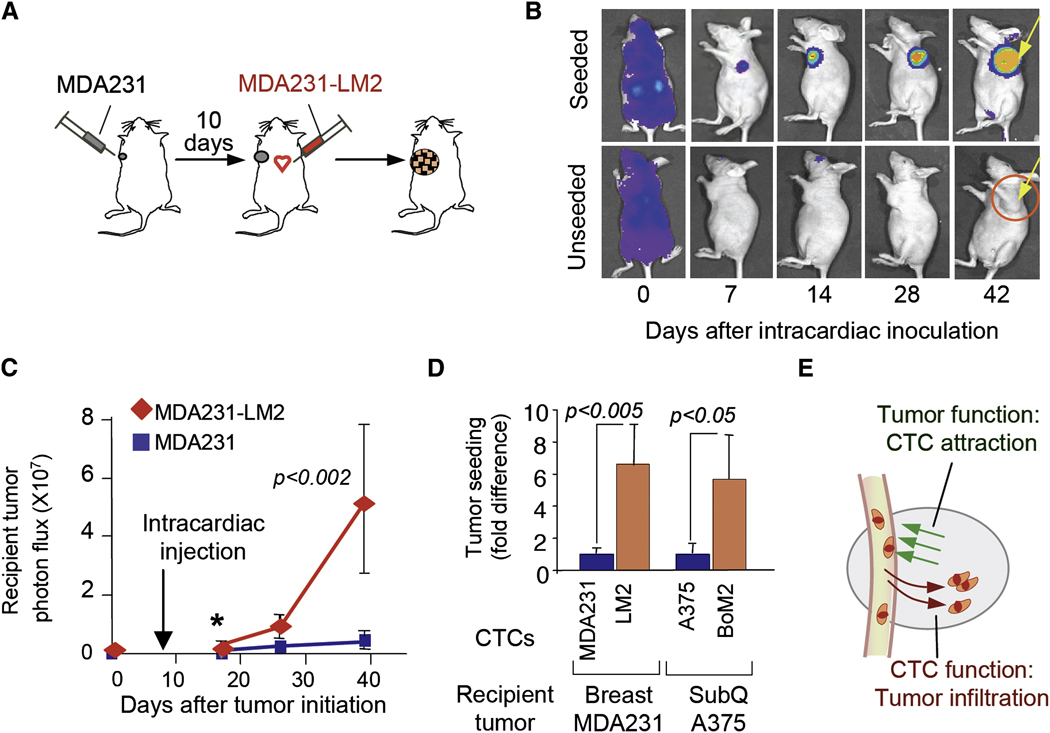
Figure 3. Tumor attraction and infiltration functions.
(A) Unlabeled MDA231 cells were injected into a mammary gland No. 2. When tumors became palpable, LacZ/GFP/luciferase-expressing MDA231-LM2 cells were introduced into the circulation by intracardiac injection.
(B) BLI of mice with seeded and unseeded tumors. Arrow, recipient tumor.
(C) Comparative tumor-seeding ability of MDA231 and MDA231-LM2 cells from the circulation. Luminescent signals from recipient tumors at the indicated time points are shown.
(D) Luminescent signals of recipient tumors from mice injected with indicated cell lines were quantified 10 (MDA-231) and 5 (A375) days after injection. n=6–10.
(E) A diagram summarizing two functions involved in tumor self-seeding.
Error bars in all cases represent SEM and p values were based on two-tailed Mann-Whitney test.

