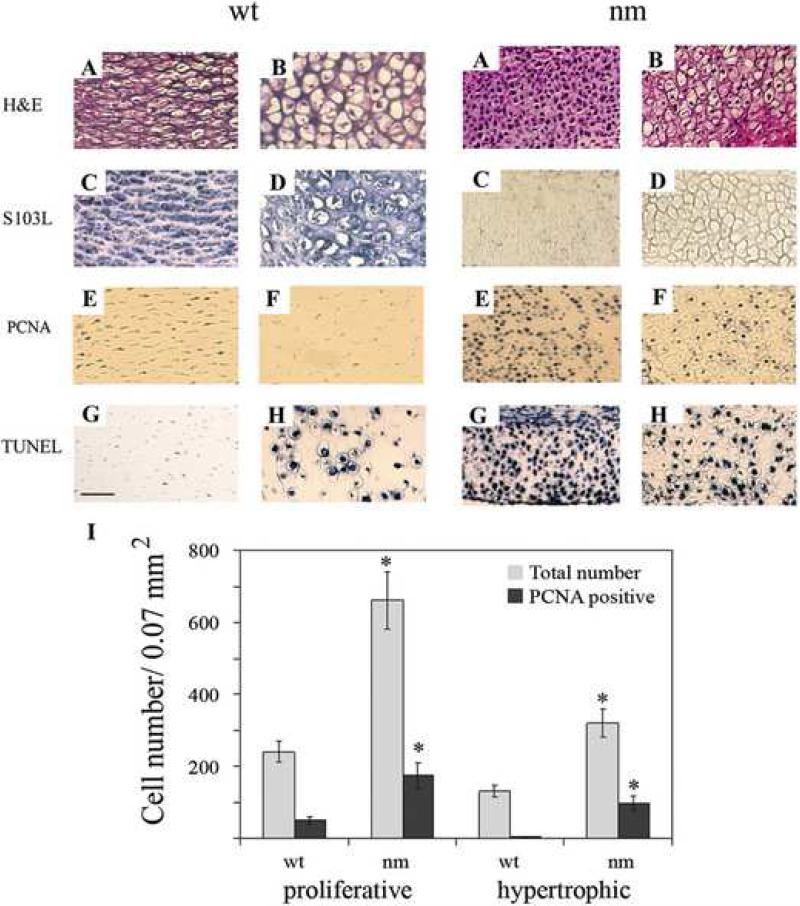
Figure 1. Patterns of cell death and proliferation in wild type (wt) and nanomelic (nm) embryos.
Images depict proliferative (A,C,E,G) and hypertrophic (B, D, F, H) chondrocyte zones from E12 wt and nm tibial limb sections. Paraffin sections were stained with hematoxylin-eosin (A, B) and immunostained with S103L antibody (C, D). Proliferative cells were detected with anti-PCNA antibody (E, F) and apoptotic cells were detected by TUNEL staining (G, H). Scale bar: 50 μm. I. Chondrocyte proliferation in wt and nm E12 limbs. Average numbers of PCNA-positive cells per field were determined by immunocytochemistry and total numbers of cells from phase-contrast photographs of the same fields. A total of 6-8 0.07 mm2 fields each from wt and nm proliferative and hypertrophic zones were counted. * p<0.0001

