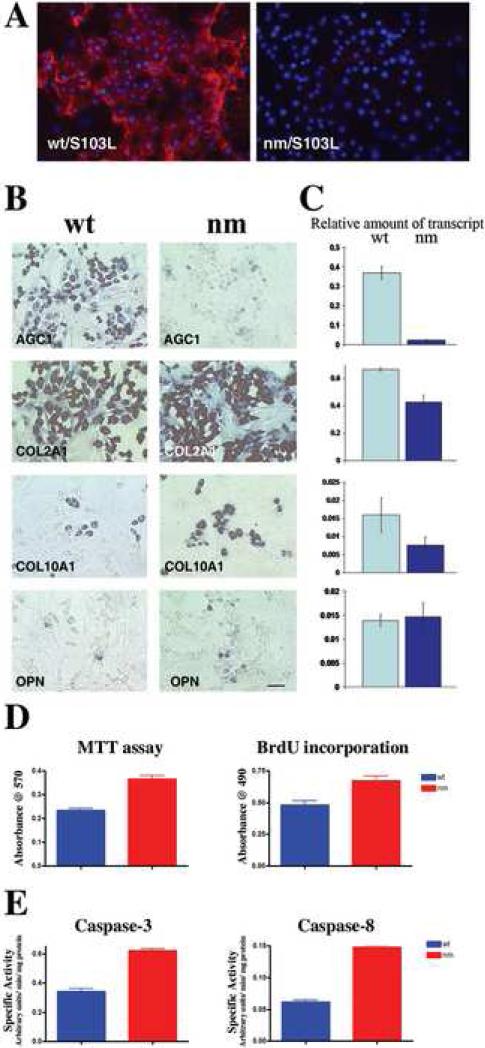
Figure 13. Expression of matrix component genes by wt and nm chondrocytes in culture.
A. Wt and nm chondrocyte cultures immunostained with S103L antibody (red) without permeabilization, so as to detect only extracellular aggrecan. B. Expression of AGG, COL2A1, COL10A1 and OPN messages detected by in situ hybridization in cultured chondrocytes from wt and nm E14 sterna. Scale bar 35μm. C. The bar graphs show levels of AGC1, COL2A1, COL10A1 and OPN transcripts relative to levels of GAPDH mRNA in wt and nm chondrocyte cultures. Quantification was performed using the same in situ hybridization protocol but replacing the NBT/BCIP substrate of alkaline phosphatase with the fluorescent substrate MUP. Determinations were performed on triplicate wells for each probe sample. Bars represent standard deviations. D. Cell-proliferation in cultured wt and nm chondrocytes. Cell viability was determined by assessing mitochondrial activity using the MTT assay and cell proliferation measured by determining 4-hour BrdU-incorporation levels for chondrocytes from wt and nm E14 sterna maintained in culture for 6 days. E. Apoptotic pathways in cultured wt and nm chondrocytes. Activation of the apoptotic pathway was assessed by determining the specific activities of caspase-3 and caspase-8 using the fluorogenic substrates Ac-DEVD-AFC and Ac-IETD-AFC, respectively. The results are shown as the mean ± SD(bars), p<0.005 for the MTT and proliferation assays and p<0.001 for both caspase assays. In all the experiments dissociated chondrocytes were culture for 8 days.

