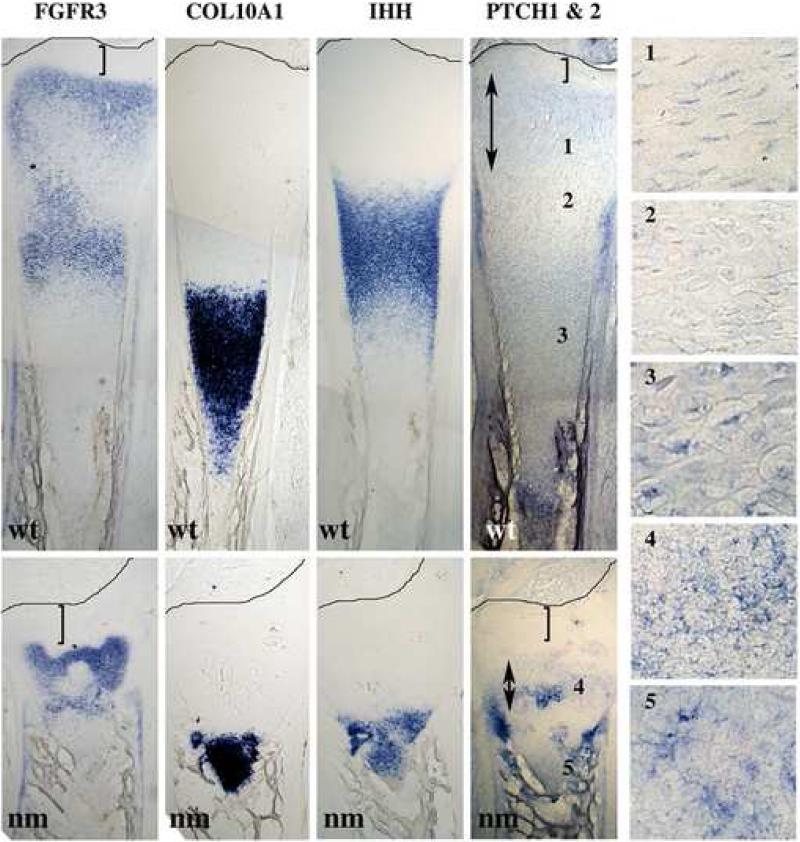
Figure 4. Comparative expression profiles.
Expression of FGFR3, COL10A1, IHH, and PTCH (1&2) mRNAs, detected by in situ hybridizations using DIG-labeled probes in serial 40 μm tibia sections from wt and nm E12 embryos. Numbered insets are close-ups of the areas indicated in the PTCH expression panel. Double arrows indicate the extent of the epiphyseal expression of PTCH. Brackets indicate the distance between the epiphyseal domain of expression and the perichondrium. Lines mark the perichondrium boundaries.

