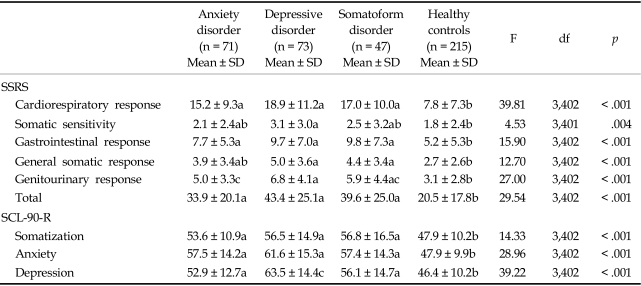
Table 6.
Scores of the SSRS and SCL-90-R Subscales in Each Patient Group and the Healthy Control Group
SSRS, Somatic stress response scale.
The same letter in a subscript indicates that the groups were similar; different letters in the subscript denote significant differences between the groups according to a post-hoc Scheffe Test (p < .05).

