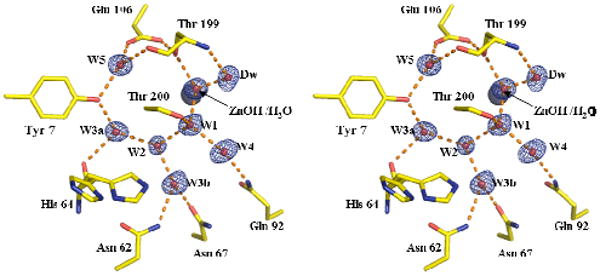
Figure 1.

Stereoview of the active site of HCA II. The zinc is represented by a gray sphere and the oxygen atoms of water molecules as smaller red spheres. Dotted lines are presumed hydrogen bonds. Stick figures are selected amino acids of the active site with both the inward and outward orientations of His64 shown. The electron density 2Fo-Fc Fourier map is contoured at 2.0σ. This figure was created using PyMOL(28).
