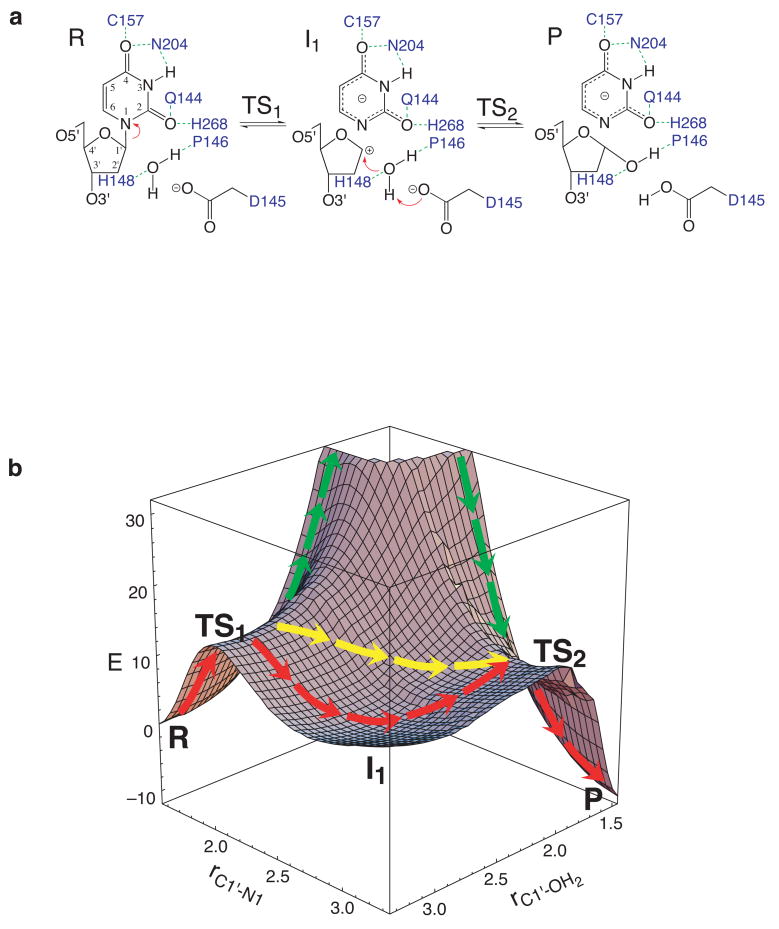
Figure 7.
Reaction mechanism of the excision of misincorporated deoxyuridinefrom DNA by the uracil-DNA glycosylase UDG. a) Schematic diagram. Electron transfers are indicated in red, hydrogen bonds in green and enzyme residues in blue. The dashed line to C157 indicates a Cα Hα···O4 hydrogen bond. b) Adiabatic potential energy surface as a function of rC1′ N1 and rC1′ OH2. In the region rC1′ N1 ≤ 2.20 Å and rC1′ OH2 ≤ 2.00 Å, the points above 32 kcal/mol are not shown for clarity. Red arrows follow the lowest energy pathway (stepwise dissociative); green arrows follow a perfect associative pathway; and yellow arrows follow a concerted pathway starting from the reactant structure. The states indicated are reactant (R), product (P), transition states (TS1 and TS2) and the oxocorbenium cation/anion intermediate (I1). (From Dinner et al.637).

