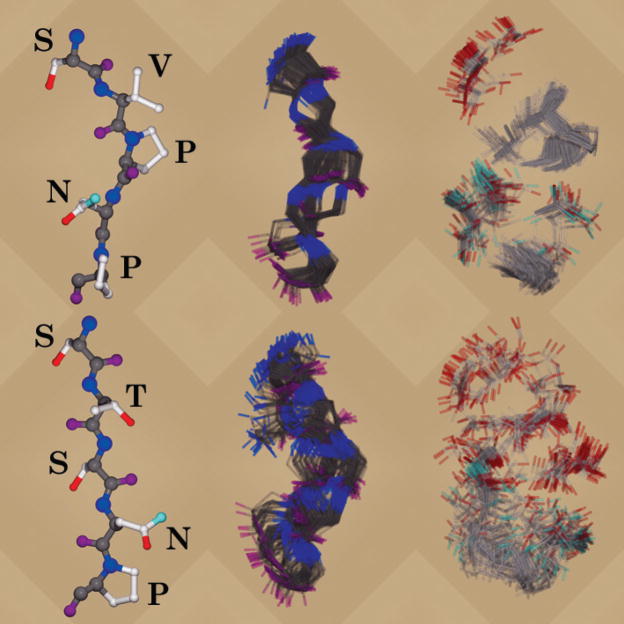
Figure 8.
Six-panel figure depicting the results of a simulated annealing procedure for an antigenic peptide (top row) and an escape mutant (bottom row). The left hand column shows the peptide sequences in the reference orientation used to align the backbones for the middle and right hand columns. The middle column shows the aligned backbones and the right hand column shows only the side chains, in the same alignment, for the final coordinates from 100 simulated annealing runs. The small Val-Pro hydrophobic patch readily apparent in the top right panel is a likely antibody recognition site.724 Each panel was produced from POV-Ray files exported via the CHARMM graphics facility; the files were edited to add the background and transparency features, and then processed into images via the POV-Ray program.

