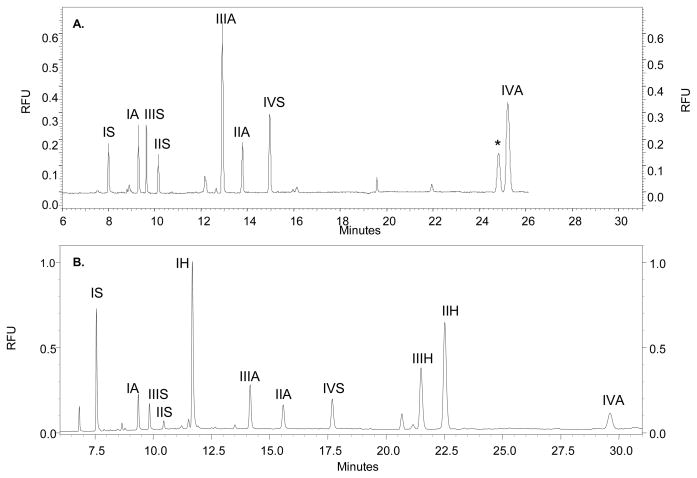
Figure 3.
A. CE-LIF electropherogram in reverse polarity mode of a mixture of 12 heparin/HS disaccharides (300 pmol each) subjected to the original AMAC derivatization protocol. Disaccharide peaks are labeled using the nomenclature from Figure 1. 8 of the 12 heparin/HS disaccharides are detected. The (*) represents a background noise peak. B. CE-LIF electropherogram in reverse polarity mode of a mixture of 12 heparin/HS disaccharides (300 pmol each) subjected to the optimized AMAC derivatization protocol. Disaccharide peaks are labeled using the nomenclature from Figure 1. 11 of the 12 heparin/HS disaccharides are detected.

