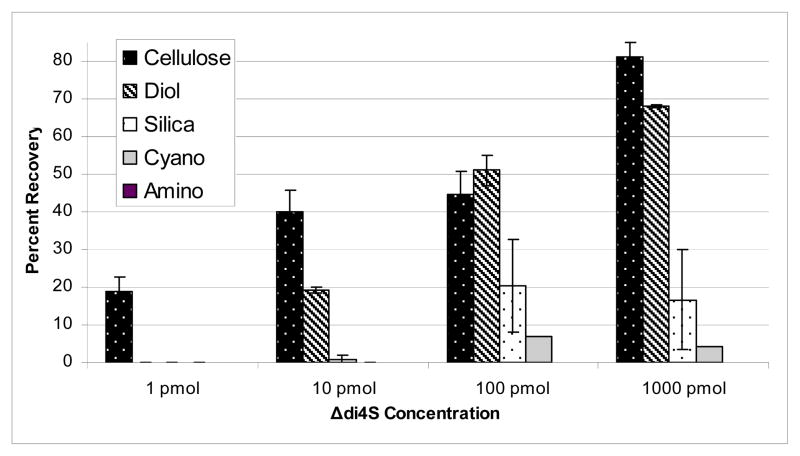
Figure 4.
Bar graph representation of the percent recovery of Δdi4S-AMAC after clean-up with micro-spin cellulose, diol, silica, cyano and amino columns. The percent recovery was calculated by dividing the percentage of the clean sample by that of the non-clean sample and multiplying by 100. The highest recovery rate was found when using cellulose micro-spin columns.

