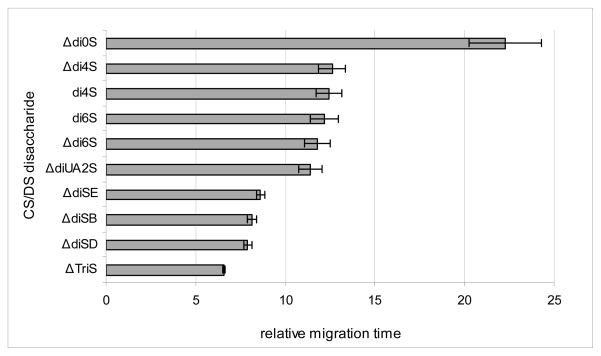
Figure 7.
Bar graph representation of the CE-LIF relative migration times of the average of eighteen repeated injections of the ten CS/DS disaccharide standards (300 pmol) over 60 days. All migration times were normalized to the migration time of the ΔHSIS internal standard spiked into every CE-LIF run. All relative migration times had standard deviations of less than 2.0 percent.

