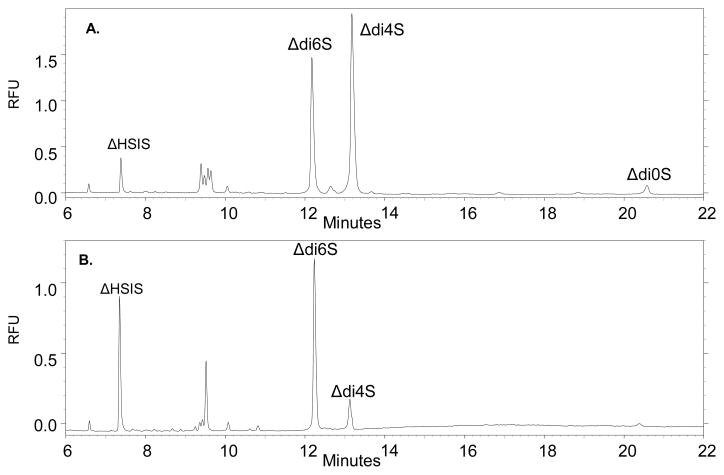
Figure 8.
A. CE-LIF electropherogram of juvenile bovine cartilage donor A explant 1 (0.5 μg) reductively aminated with AMAC. B. CE-LIF electropherogram of adult human cartilage donor A explant 1 (0.5 μg) reductively aminated with AMAC. ΔHSIS represents the internal standard spiked into each sample for quantification purposes. Δdi4S represents the percentage of ΔHexAGalNAc4S, Δdi6S represents the percentage of ΔHexAGalNAc6S, and Δdi0S represents the percentage of ΔHexAGalNAc. Small peaks present at approximately 9.5 minutes are minor contaminants present in all samples, including negative controls.

