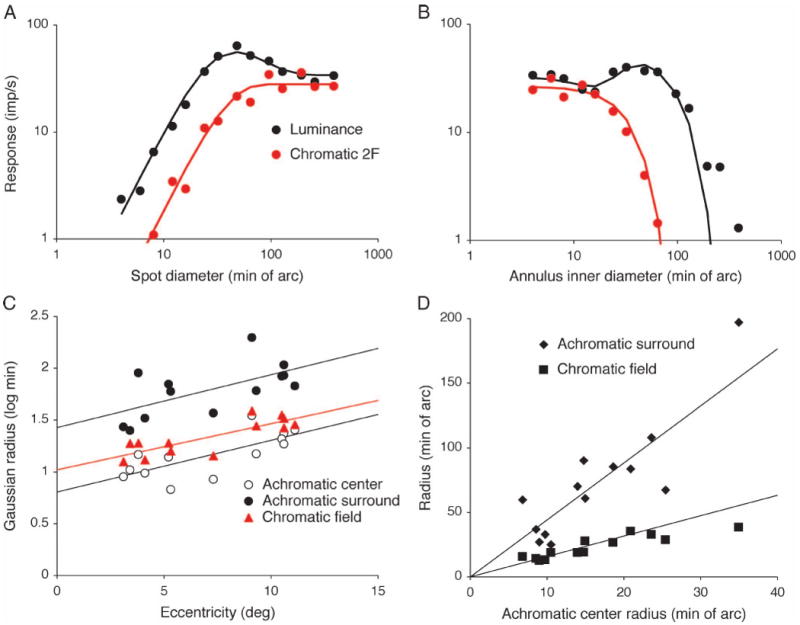
Figure 3.

Area summation curves for the different response components. Response amplitude for modulated spots (A) or annuli (B) for a representative MC cell. Luminance (30% contrast) or |M – L| chromatic modulation responses (30% RMS cone contrast, R/G ratio adjusted to each cell's 1st harmonic null) are shown. 5 Hz modulation, 32 cycles. Amplitude and phase (not shown) were fitted as described in the text (solid lines). Free parameters of interest are achromatic center and surround sizes (σc, σs) and size of the chromatic field (σchr) generating the 2F response. (C, D) These parameters (σc, σs, σchr) are plotted against eccentricity in C for an MC cell sample and fitted with the linear relations shown. The 2F chromatic response field (σchr) is of intermediate size to achromatic center (σc) and surround (σs). (D) Size of achromatic surround (σs) and chromatic 2F field (σchr) plotted against achromatic center radius (σs), with linear regression lines. Data are again consistent with a mechanism larger than the achromatic center (σc) but smaller than the achromatic surround (σs).
