
Figure 6.
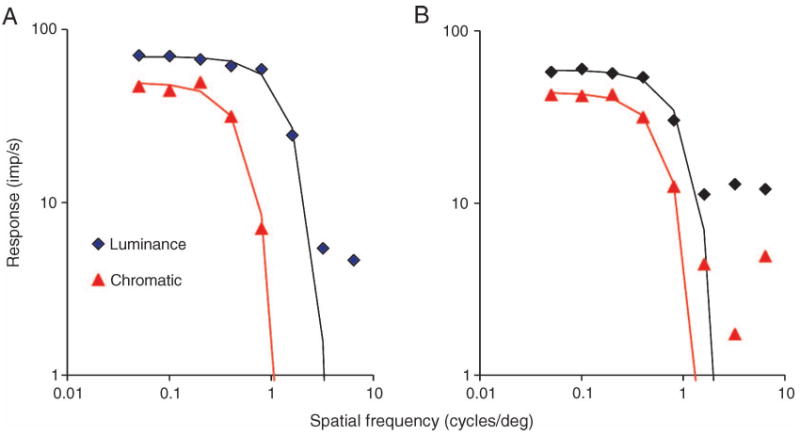
Spatial frequency tuning curves for two MC cells for the 2F chromatic response and the achromatic response. Both were acquired at constant modulation contrast (achromatic 30%, chromatic ∼27% RMS contrast for the M and L cones; temporal frequency 5 Hz, averaged over 32 sweeps). In the examples shown, the achromatic tuning curves show little low spatial frequency attenuation. The high spatial frequency cut-off is lower for chromatic modulation.