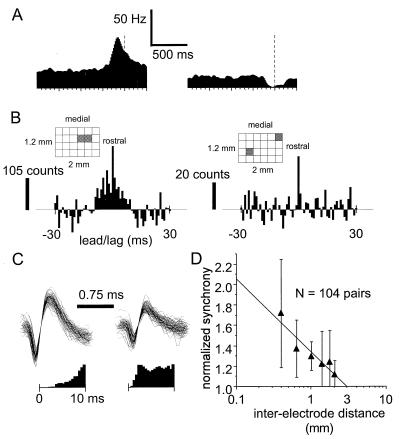
Figure 1.
(A) Firing rate modulation of two simultaneously recorded MI neurons showing a movement related increase (Left side) and decrease (Right side). Peri-event time histograms are aligned on movement onset (dashed line) and are based on movements in a single direction. (B) Range of temporal precision of synchrony for pairs of recorded neurons. The relative positions of the recording sites on the array are shown as gray boxes on a grid. Below are shown CCHs between two pairs of neurons. A trial-based shift predictor representing the expected number of chance coincidences has been subtracted from the histograms. Broadly correlated discharge peaked at zero time lag (1 ms bin widths) (Left side), computed from data in the interval from trial start to the end of movement for all movement directions. Sharply correlated discharge at zero time lag (Right side). In this example, the data is restricted to a 700-ms interval after the go cue for a single movement direction. (C) All synchronous extracellular waveforms (±500 μs) recorded from two electrode sites that were used to compute the histogram on the Right side of B. These waveforms were recorded during a single recording session. Synchronous and nonsynchronous waveforms for both neurons were not different in initial peak amplitude (two-tailed t test, P < .01). Autocorrelation functions are shown below. (D) Synchronous interactions between neurons is evident at sites up to 3 mm apart. The strength of synchrony (normalized) shows a negative log-linear relationship with inter-electrode distance. Normalized synchrony values were computed by taking the ratios of the cross-correlation value at zero time lag (1 ms bin width) to the trial-based shift predictor value. Data were taken from a 700-ms period about movement onset. Error bars represent one SD.

