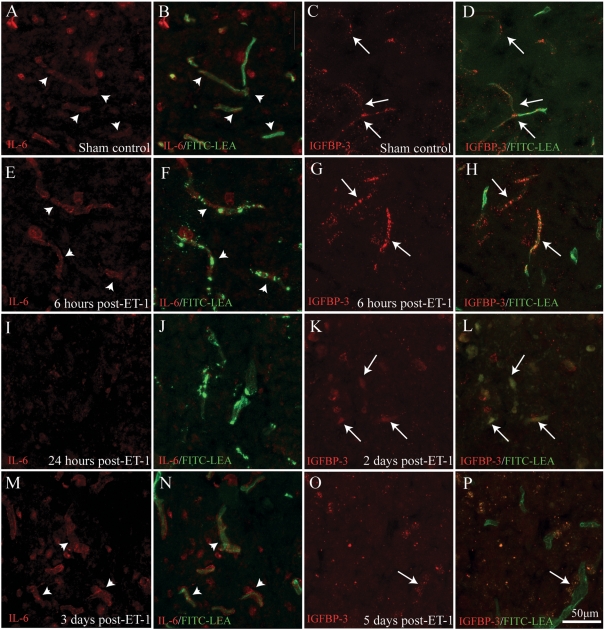
Figure 5. smvEC expression of IL-6 and IGFBP-3 after SCI.
Basal levels of expression for both IL-6 (A and B; arrowheads) and IGFBP-3 (C and D; arrows) were detected in the vasculature in control spinal grey matter. Increased IL-6 immunoreactivity was observed in smvECs at 6 h post-ischaemia (E and F; arrowheads). Interestingly, this expression appeared to exhibit a biphasic pattern, with qualitative levels diminished at 1 day (I and J), but reappearing in activated microvascular profiles by 3 days post-ischaemia (M and N; arrowheads). Similar to IL-6 staining, levels of IGFBP-3 immunoreactivity were intensified by 6 h post-ET-1 microinjection (G and H; arrows). However, levels were then found to diminish progressively beginning at 2 days post-ischaemia (K and L; arrows), with little IGFBP-3 immunoreactivity associated with perfused microvessels 5 days post-ischaemia (O and P; arrow). Scale bar = 50 μm (A–P).

