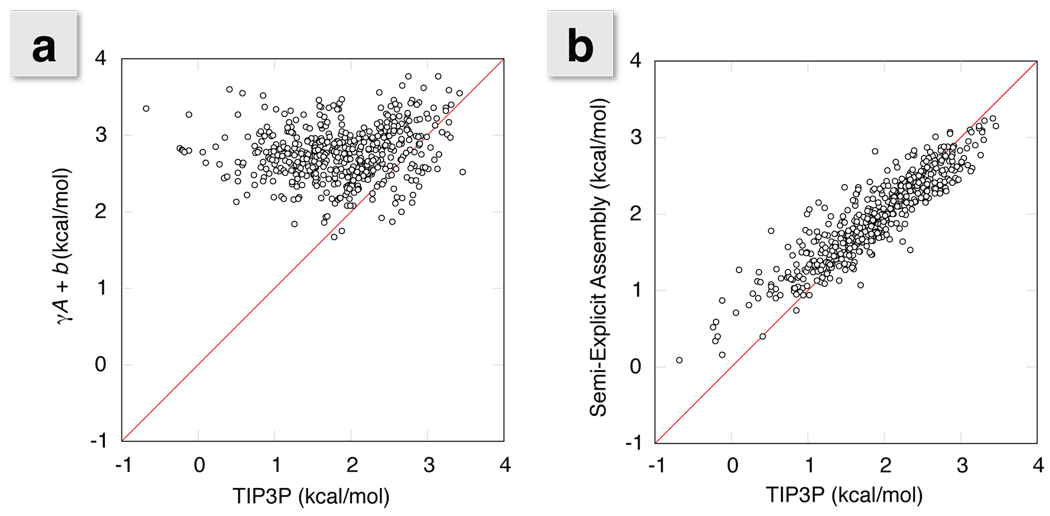
Figure 5.
Correlation plots of ΔG values comparing a) γA + b and b) our Semi-Explicit Assembly technique with the ΔG values from explicit solvent free energy calculations. A detailed incorporation of dispersion interactions takes what was originally a flat correlation and brings it much more in line with explicit solvent results. This results in a correlation coefficient improvement from 0.15 to 0.91 and an RMS deviation decrease from 1.2 kcal/mol down to 0.3 kcal/mol over the entire set.

