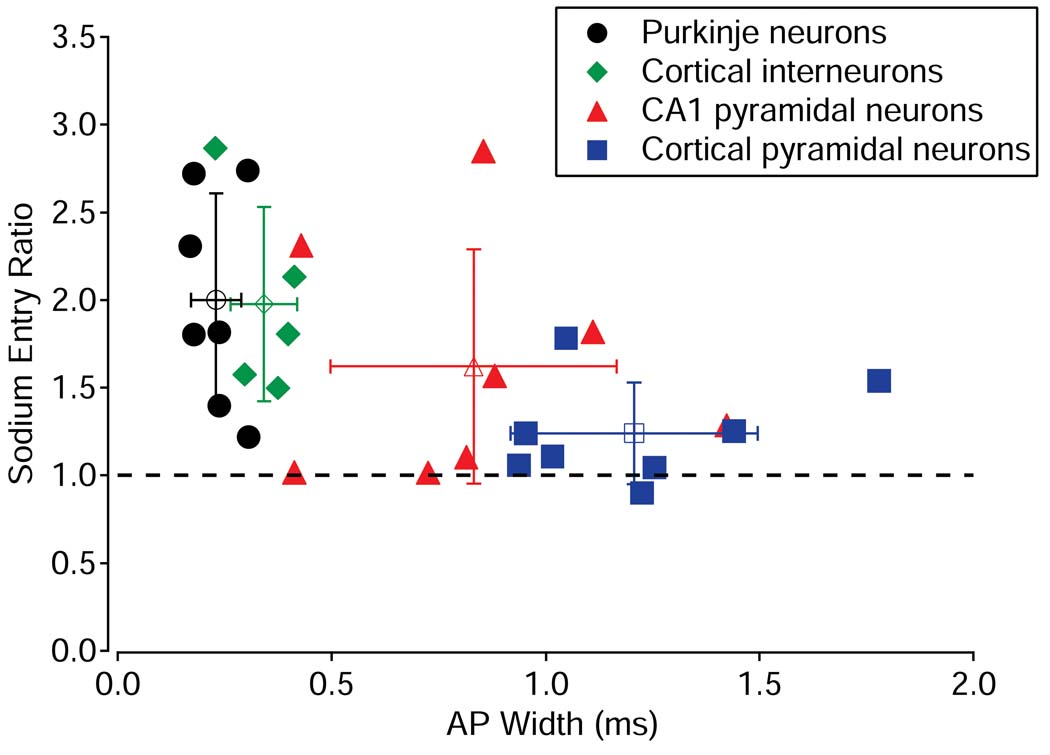
Figure 4. Collected results for sodium efficiency in four neuronal types.
Sodium efficiency in all neurons tested, plotted as a function of action potential width. Filled symbols show measurements for individual neurons; open symbols and error bars represent the mean ± standard deviation for each cell type.

