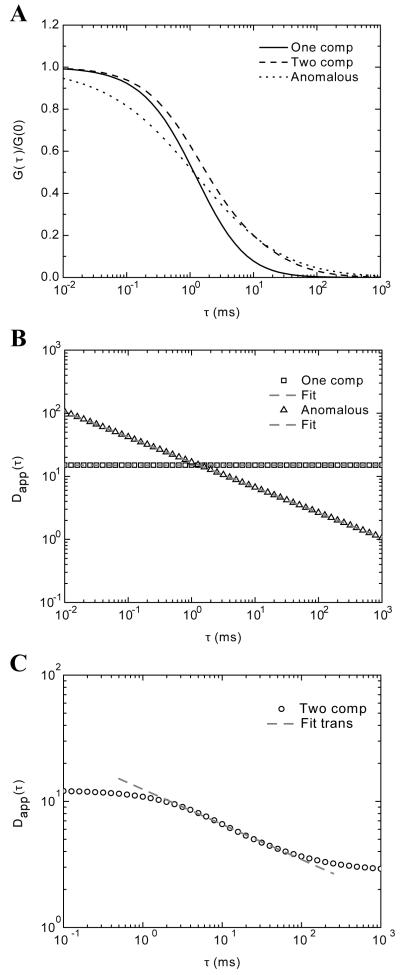
FIGURE 1.
Data generated from various ACF models. A) Single component, two component and anomalous diffusion autocorrelation data generated from Eq. 10, 12, and 18, respectively. B) The numerical inversion of Eq. 24 on the data generated from a one component ACF shows a flat temporal spectrum of the apparent diffusion (squares) that returns an apparent D of 15 μm2/s. The data generated from the anomalous diffusion ACF shows a power law dependence (triangles). The fitted values with a power law model are α= 0.6 and Γ = 6.33 μm2/sα. C) The result of numerical inversion for Dapp(t) for the case of data generated with the two-component model of the ACF Eq 12 is shown. This result shows a transition between two normal modes of diffusion. The transition region from x ms to x ms was fit with an anomalous diffusion model which returned an α = 0.72.

