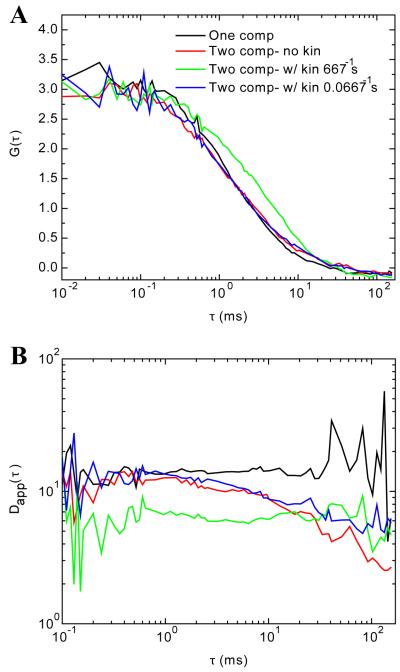
FIGURE 2.
FCS data generated with SimFCS. A) Shows the simulated data for either one diffusive component (black curve) and for the case of A↔B at three different conditions i) R = 0 (red curve), ii) R = 667 s−1 (green curve), and iii) R = 0.0667 s−1 (blue curve). Refer to the Methodology section for additional details concerning the simulations. Evaluating the ACF, the only significant difference is in the case of (ii) where the rate of transition of A↔B is on the same time scale as the transition time of the molecule through the focal volume. However, when Dapp(τ) is extracted there are clear differences in the spectra as shown in panel (B). The single component data (black trace) shows a flat line across the temporal spectrum as anticipated. With two component data (red trace) there is a period of normal diffusion at short timescales (<1 ms) which then shows a downward decay from 1-100 ms. When kinetics are added, where the rate of transition between two diffusing states is slow (0.0667 s−1; blue trace), we again see a region of normal diffusion that shows a downward trend up to ~100 ms. When the transition rate is fast (667 s−1; green trace), the curve is flat, as in the one component case (black curve) and the amplitude has decreased to reflect the average diffusion of the two components.

