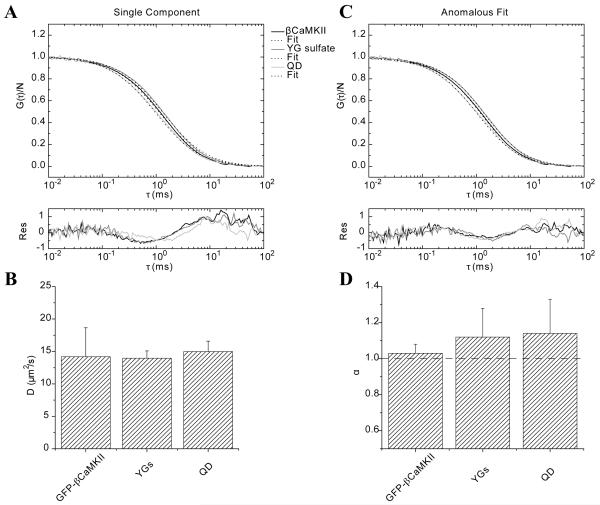
FIGURE 4.
Fluorescence correlation analysis of Quantum Dots (Qdots), YG spheres and eGFP-βCaMKII diffusing in buffer. A) Raw data and fits using a single component model and their residuals. B) Same data as that shown in panel A fitted with the anomalous diffusion model. Residuals show a slightly better fit than the single component model. C) The average diffusion at τDa coefficient of three independent experiments is plotted for each sample. The error bars represent the standard deviations. D) α exponent from the anomalous model fit for the same samples in buffer. A straight line at α=1 (normal diffusion) is shown as a reference.

