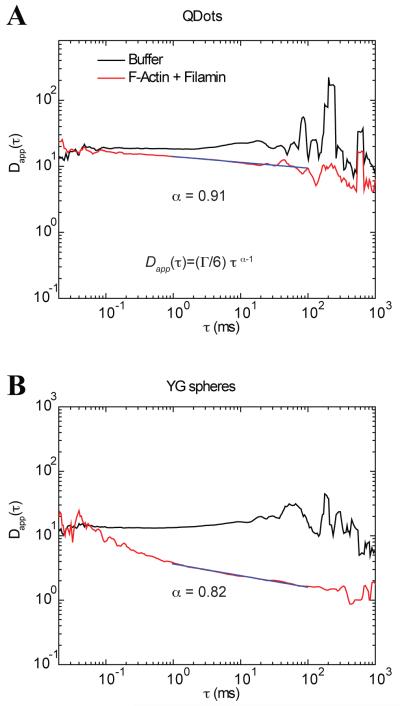
FIGURE 7.
Diffusion as a function of time of Qdots and YG spheres in buffer and in F-actin with filamin. A) Diffusion profile for Qdots in buffer shows a constant value for most of the time domain. For the case of Qdots in F-actin/filamin (red curve) there is a slight downward trend in the data. The fit of the same data to the anomalous model returned an α value of 0.91. This value was used to fit a line to the curve with extending end points until a deviation (> 0.05%) was detected and revealed that the spectral domain that fell within this criteria was from 1 to 100 ms (magenta line). B) Diffusion spectra of YG spheres under the same conditions as in panel A. In buffer, the profile is again flat for almost the entire time-domain. In F-actin/filamin the regime at which power law fit maintained an anomalous exponent of 0.82 ranges from 1-100 (magenta line).

