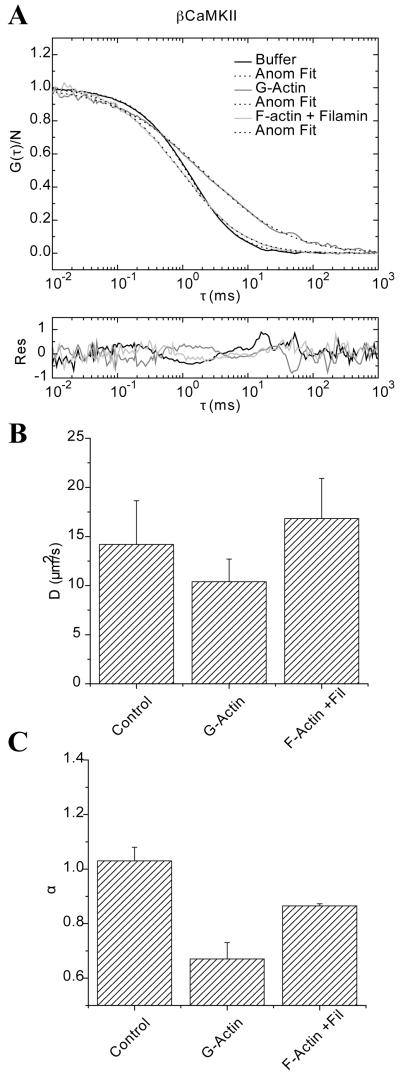
FIGURE 8.
Fluorescence correlation spectroscopy of eGFP-βCaMKII in buffer, G-actin and F-actin cross linked with filamin. A) Raw data and fitting using the anomalous diffusion model. Residuals for each fit are shown below the plot. B) The average apparent diffusion values in the same conditions are presented as bar plots. Day-to-day variations are shown as the error bars representing the standard deviation. Panel C) shows the average and standard deviation of the anomalous exponent for the same samples.

