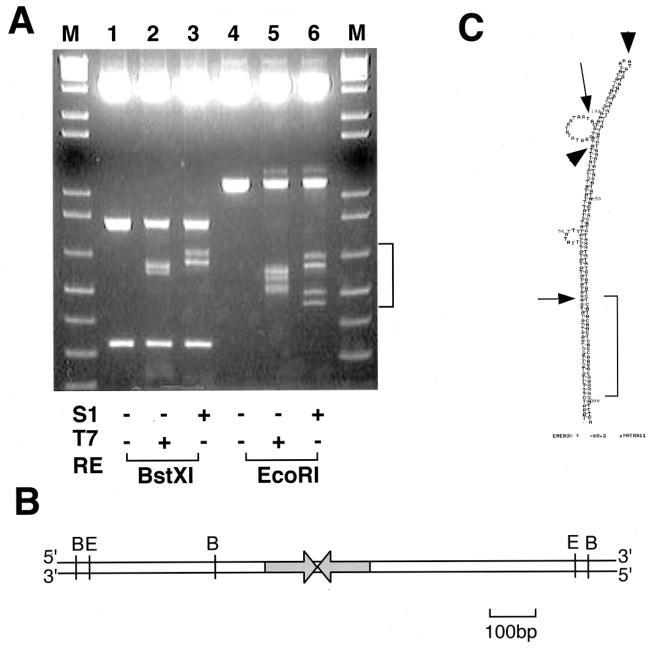
FIG. 4. Mapping of nuclease cleavage sites in the PATRR.
A, mapping by digestion with restriction enzyme. S1, S1 nuclease; T7, T7 endonuclease; RE, restriction enzyme. B, restriction map of the PATRR-flanking region. C, mapping by sequencing. The entire PATRR is shown as a putative hairpin structure predicted by mfold software (mfold.burnet.edu.au/dna_form). The arrows indicate cleavage sites with T7 endonuclease, whereas the arrowheads indicate those with S1 nuclease. the relatively GC-rich region is indicated by a bracket.

