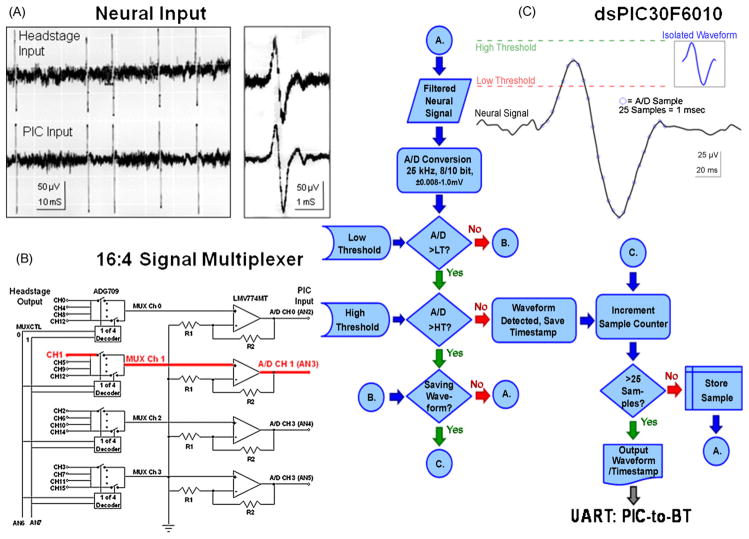
Fig. 2.
Stages of UBAT processing. (A) Oscilloscope tracings of neuronal spike input signals. Top trace is recoded at input to the T16G100 headstage and illustrated at raw signal amplitude (±50 μV). Bottom trace is the same signal after headstage filtering (250 Hz to 6.0 kHz) and conditioning prior to input to the dsPIC30F6010 A/D processing stage (Fig. 1). Expanded traces at right illustrate similarity of neuronal waveform even after processing through respective stages of the circuit (waveform in C). (B) Block circuit diagram for 16:4 channel multiplexer shown in Fig. 1. Bold red line indicates specific signal path (shown also in Fig. 1) for single neuron events (waveforms) identified by input channel (Ch. 1). (C) Diagram of spike waveform detection in PIC. Filtered, amplified neuronal waveforms are digitized at 25 kHz and compared to adjustable threshold voltages for an “amplitude window” corresponding to action potential “peak” voltage. Waveform amplitudes between the low and high threshold settings generate a timestamp that records time of occurrence. The neuron waveform, consisting of 5 A/D samples before and 20 samples after threshold crossing, is saved for further processing. A data packet consisting of channel number, timestamp and waveform is assembled for transfer to the Bluetooth transceiver, via complementary Universal Asynchronous Receiver Transmitter (UART) ports on both the dsPIC30F6010 and WT12 Bluetooth transceiver, and the data packet is then transmitted to the host computer (Fig. 1).

