Fig. 3.
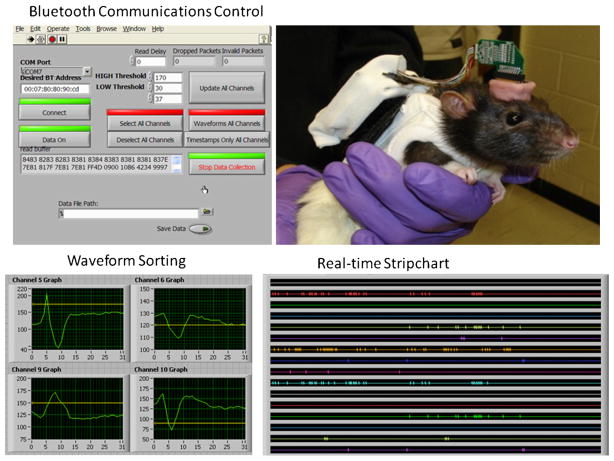
Photographs depict various aspects of UBAT function. Photo at upper right shows UBAT on a rat with headstage and battery mounted on backpack that contains prototype board shown in Fig. 1. Upper left shows monitor display of UBAT user interface for controlling Bluetooth connection state, program variable settings, and monitoring of the serial data stream containing channel identification, timestamps, waveform amplitudes thresholds, and transmission error indicators. Lower Left shows online display of captured neural waveforms which can range across all channels and are updated continuously or on demand. Each display shows the baseline and upper amplitude threshold level set for each captured waveform (Fig. 2). Photo at lower right shows online stripchart display of the UBAT captured waveform timestamps in real-time display of all channels. All display programs were custom programmed in Labview (National Instruments) designed specifically to receive PIC processor A/D converted signals from UBAT.

