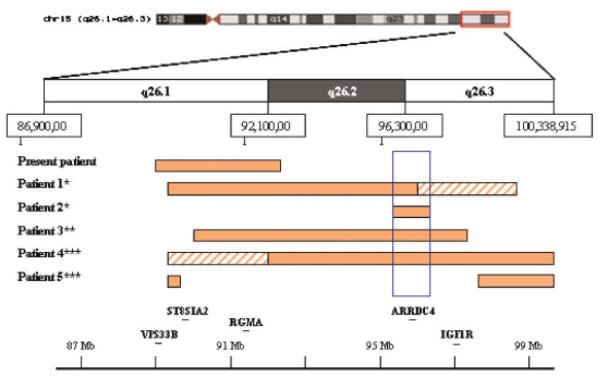
Fig. 6.
Comparison of deleted segments of four 15q26 microdeletion cases and two ring chromosomes 15 involving breakpoints in 15q26. Solid bars indicate deleted regions confirmed by FISH or microsatellite markers; hatched bars indicate possible deletions that were not confirmed due to uninformative microsatellite markers. The blue rectangle indicates the segment associated with a severe phenotype. *Slavotinek et al. [2005], **Klaassens et al. [2005], and ***Glass et al. [2006]. [Color figure can be viewed in the online issue, which is available at www.interscience.wiley.com.]

