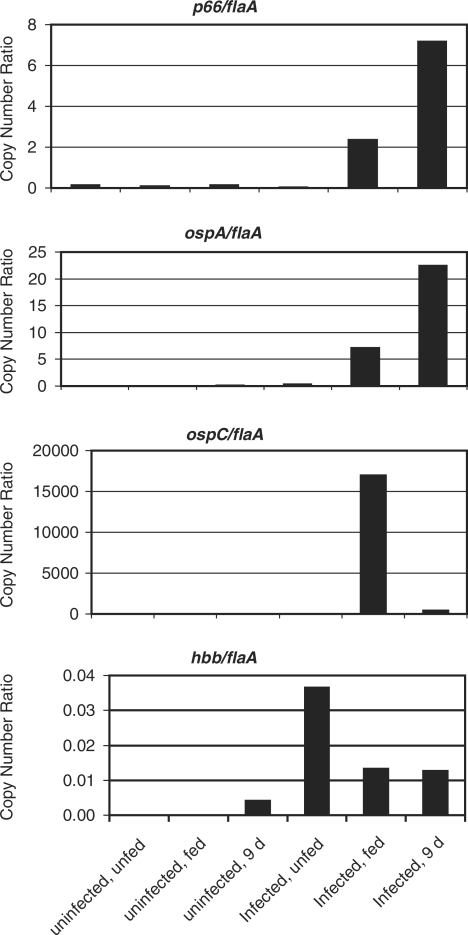
Figure 1.
Quantification of mRNA levels of select B. burgdorferi genes in ticks. Midguts were removed from ticks that were either uninfected or infected with B. burgdorferi, and unfed, fed to repletion (‘fed’), or 9 days post-repletion. The cDNA prepared from total RNA was used as the template for quantitative PCR. Ct values were determined for each cDNA sample generated in the presence and absence of RT. Copy numbers were determined against standard curves of genomic DNA. The flaA and flaB primer sets generated similar standard curves, so data shown are normalized to flaA. The p66 results are shown for primer set p66-CC (Table 1). Results shown are from one cohort of ticks. A second cohort gave rise to higher ‘background’ in the uninfected controls, and somewhat different absolute transcript numbers, but the expression trends were similar. Note the very different quantities of the transcripts for each gene normalized to flaA.

