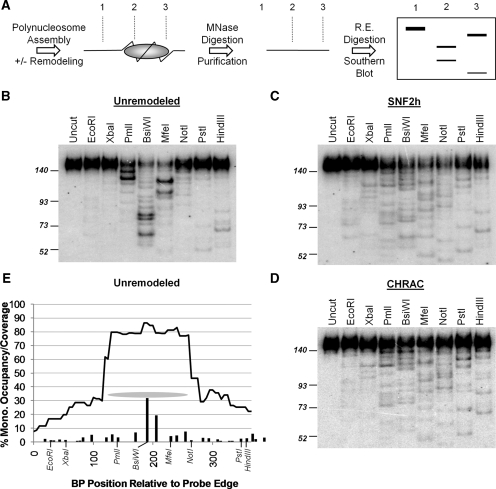
Figure 1.
MNase footprint restriction mapping of nucleosome positions. (A) Outline of method (see text for details). (B–D): representative Southern blots, used to map mononucleosomes over the 601 NPS region, under the indicated conditions. The positions of molecular weight markers (in bp) are shown on the left. (E) Quantitation of the blot shown in (B). Bars: ‘percentage mononucleosome occupancy’ (e.g. the percent of templates with a nucleosome centered over each location). For simplicity of presentation, bars correspond to nucleosome occupancy over 5 bp regions (e.g. the bar at position 50 covers 47.5–52.5 bp). In almost all cases each bar corresponds to a single nucleosome position. Curved line: ‘percentage mononucleosome coverage’ considering all mapped positions (e.g. the fraction of templates on which nucleosomes cover any given site). Grey oval: the area covered by the major position centered over the BsiWI site. The positions of the restriction sites used are shown in italics.

