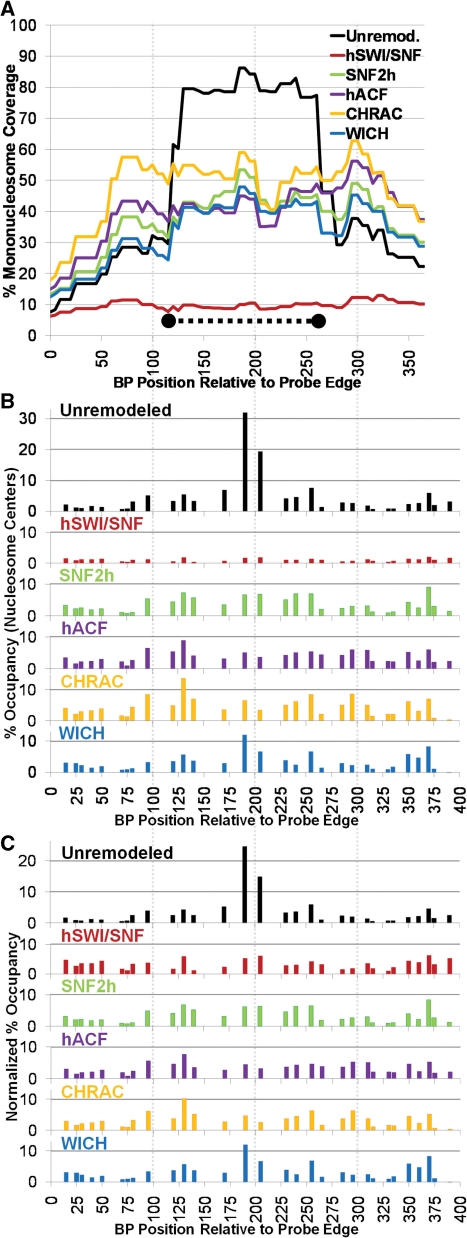
Figure 2.
All remodelers cause a similar redistribution of mononucleosomes around the 601 NPS. (A) Percentage mononucleosome coverage over the 601 polynucleosome probe region for each remodeler tested. The position of the 601 NPS, from prior studies, is shown as a thick dotted line. (B) Percentage mononucleosome occupancy. (C) Normalized percentage occupancy: to better compare the distribution of mononucleosomes between remodelers, the data in (B) was adjusted so that the total percent occupancy for all positions equaled 100%.

