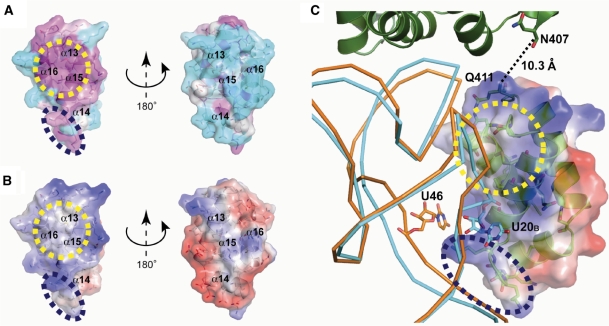
Figure 3.
(A) Surface representation with a ribbon diagram of S. aureus tail domain is shown, and is colored by the sequence conservation among bacterial GatB using the program ConSurf 3.0: from low to high (cyan to white to magenta). The conserved hydrophobic pocket and the Lys rich motif are shown as yellow and purple dashed circles, respectively. (B) Solvent-accessible surface with a ribbon diagram of S. aureus tail domain is shown in the same orientation as (A) and is colored according to the electrostatic potential calculated by the program APBS running on Pymol (blue for positively charged and red for negatively charged). (C) The S. aureus tail domain docking model. S. aureus tail domain is shown as in (B). Orange and cyan ribbon diagram indicate E. coli tRNAGln and T. thermophilus tRNAGlu, respectively. Supplemental nucleotides of the variable loop of E. coli tRNAGln and the D-loop of T. thermophilus tRNAGlu are shown as a stick model. The helical domain from the S. aureus GatB:tRNAGln docking model (described below) shown together. The inter-domain loop between the helical and the tail domain is shown as dashed lines.

