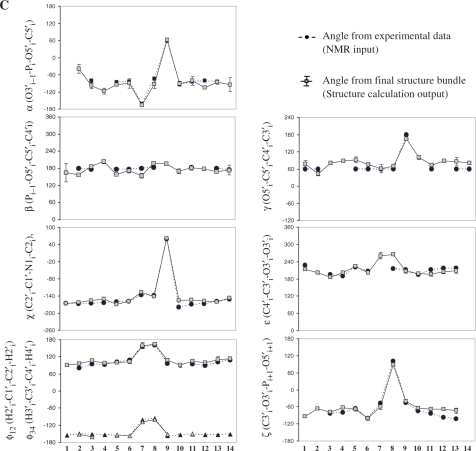
Figure 5.
Structural analysis. (A) Structural statistics from the final structure calculated with NOE distance restraints, dihedral angles and RDCs. (B) Correlation of experimental dihedral angles derived from NMR data and dihedral angles in the final structure bundle averaged over 20 structures. Error bars indicate the experimental precision of the input data. (C) Correlation of experimental dihedral angles derived from NMR data and dihedral angles in the final structure bundle averaged over 20 structures and plotted to the sequence. Error bars indicate the angle deviation within the calculated structure bundle. Comparison of dihedral angles from the new solution structure and X-ray data for the cUUCGg tetraloop see Supplementary data (Figure S2).


