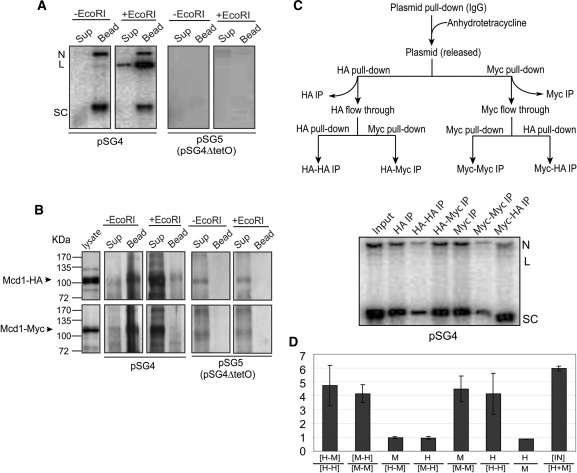
Figure 4.
Distinction between embrace and bracelet models for plasmid cohesion: cohesin stoichiometry tested by sequential immunoprecipitation. (A and B) The expected outcomes for plasmid immobilization via TetO affinity interaction followed by DNA linearization were experimentally verified. Plasmid molecules associated with Protein A-TetR bound to TetO were pulled down by IgG beads. DNA and protein remaining associated with the beads or released into the supernatant in the absence of EcoRI treatment or following EcoRI digestion were followed by Southern and western analyses, respectively. (C) The flow-chart for the two-step immunoprecipitation assays is diagrammed at the top. Plasmids were first trapped on IgG beads as in A, and then released by treatment with anhydrotetracycline. Equal amounts of the supernatant containing the freed plasmid were immunoprecipitated with the HA- or Myc-antibody. The leftover plasmid molecules in the supernatant were subjected to a second round of immunoprecipitations. (D) The histograms denote the mean ratios of Southern blot signals for immunoprecipitated DNA from three independent experiments, with the error bars showing standard deviations. Immunoprecipitations with HA- and Myc-antibodies are represented by ‘H’ and ‘M’, respectively. Sequential immunoprecipitations by these antibodies are indicated by the two letters separated by a dash. The ratio of the input (IN) plasmid DNA to that immunoprecipitated by the HA- and Myc-antibodies combined is given as IN/[H + M]. The immunoprecipitable plasmid fractions were 17.33%, 16.50%, 16.46% in individual assays.

