
Figure 3. Transfer Index and Washout.
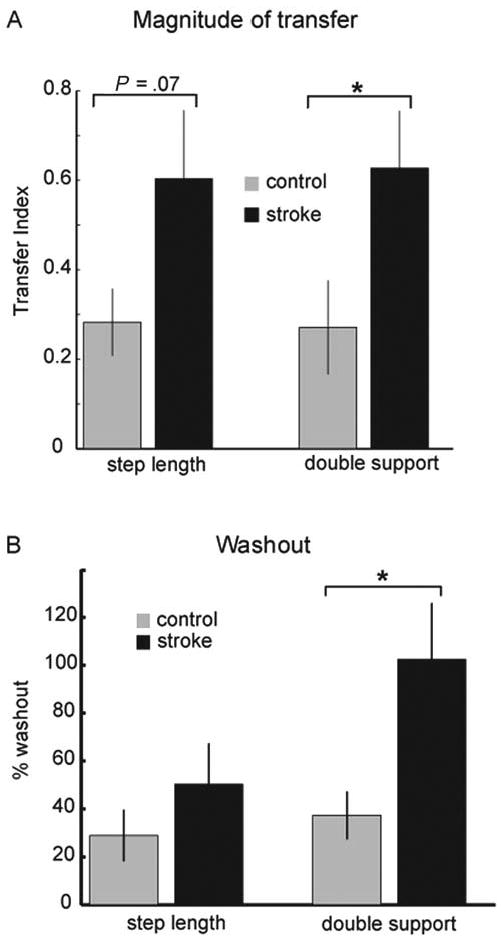
Note: A, Transfer index for control subjects (gray bars) and stroke survivors (black bars) for step length (leftmost 2 bars) and double support. The transfer index indicates the amount of adaptation transfer from the treadmill to overground walking in each group. For both adapted parameters, this value is greater in the stroke survivors. Error bars indicate ±1 standard error. Asterisk indicates a significant difference between groups. B, Percentage washout of the treadmill aftereffect caused by overground walking for the control subjects (gray bars) and the stroke survivors (black bars) for step length (2 leftmost bars) and double support. Data for this figure are from a subset of 4 stroke survivors and 9 control subjects who participated in this portion of the study. Error bars indicate ±1 standard error. Asterisk indicates a significant difference between groups.